How to improve forecasting at your greenhouse business
Added on 31 July 2023

Create the “per” KPI’s along the way…. per order, per customer, per association, per greenhouse, per acre, etc. Understand your historical “curve” — the percent complete curve — that allows you to assess progress versus your history.
The key to success using this tool is understanding that the curve ends at 100%. If your YTD revenues forecast, based on historical curves, is running significantly ahead or behind budget, you need to adjust the endpoint to reflect where the 100% of the season might be and then react accordingly.
While it may sound silly, KPI’s are numbers, not words. A pet peeve of mine over my entire career is when a question is answered with “a lot.” A lot is not a number. Try to double “a lot” next year…you need to be as specific as you can be at each level.
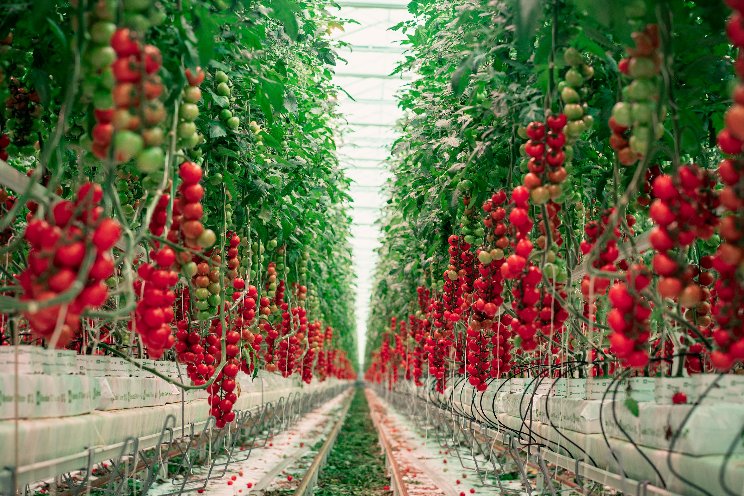
Image by ArthurHidden on Freepik
More news
